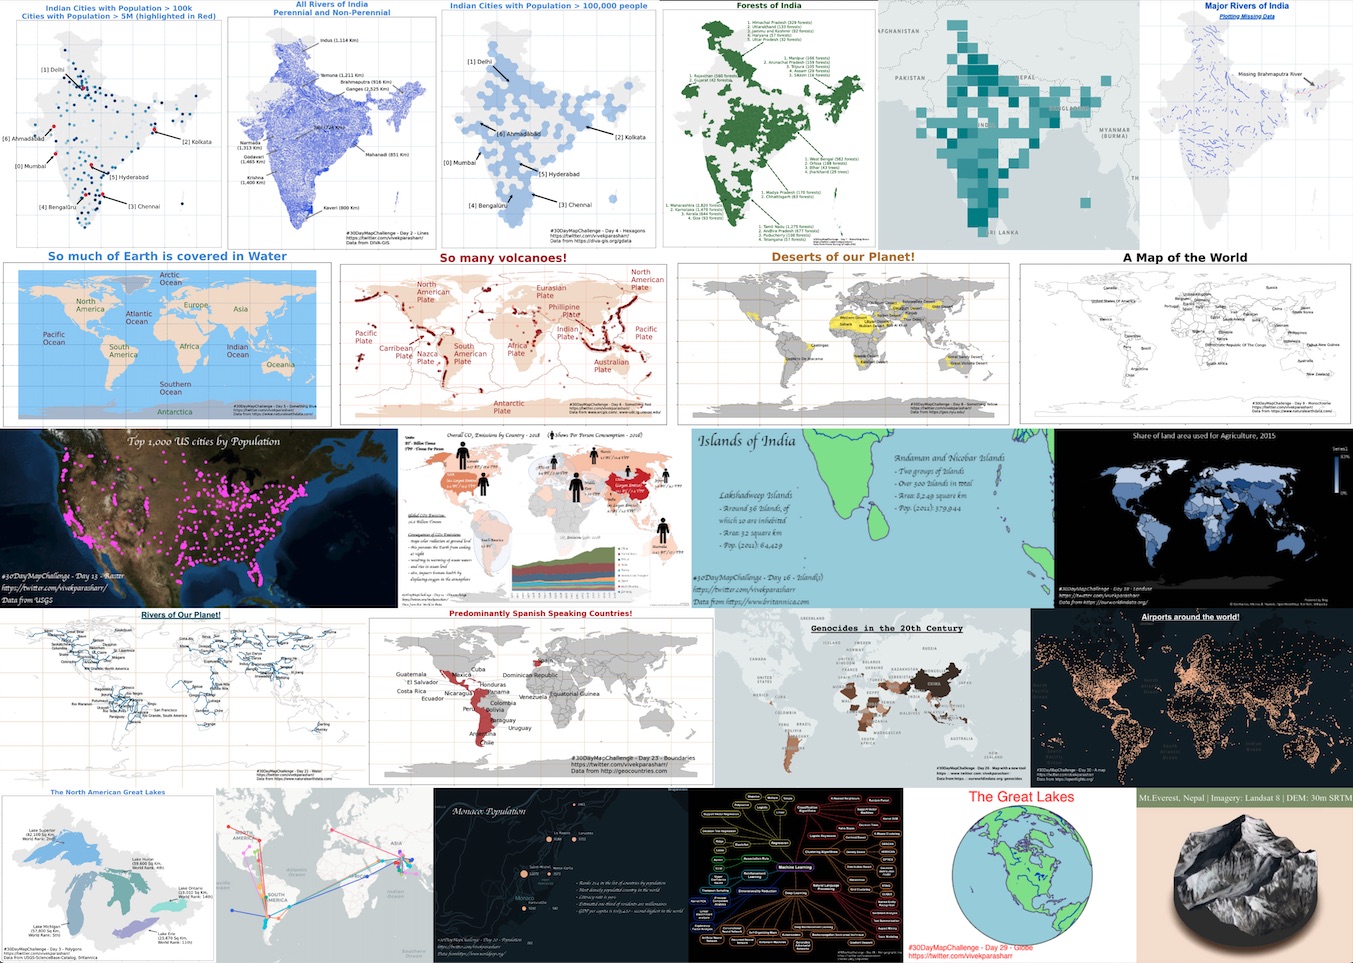
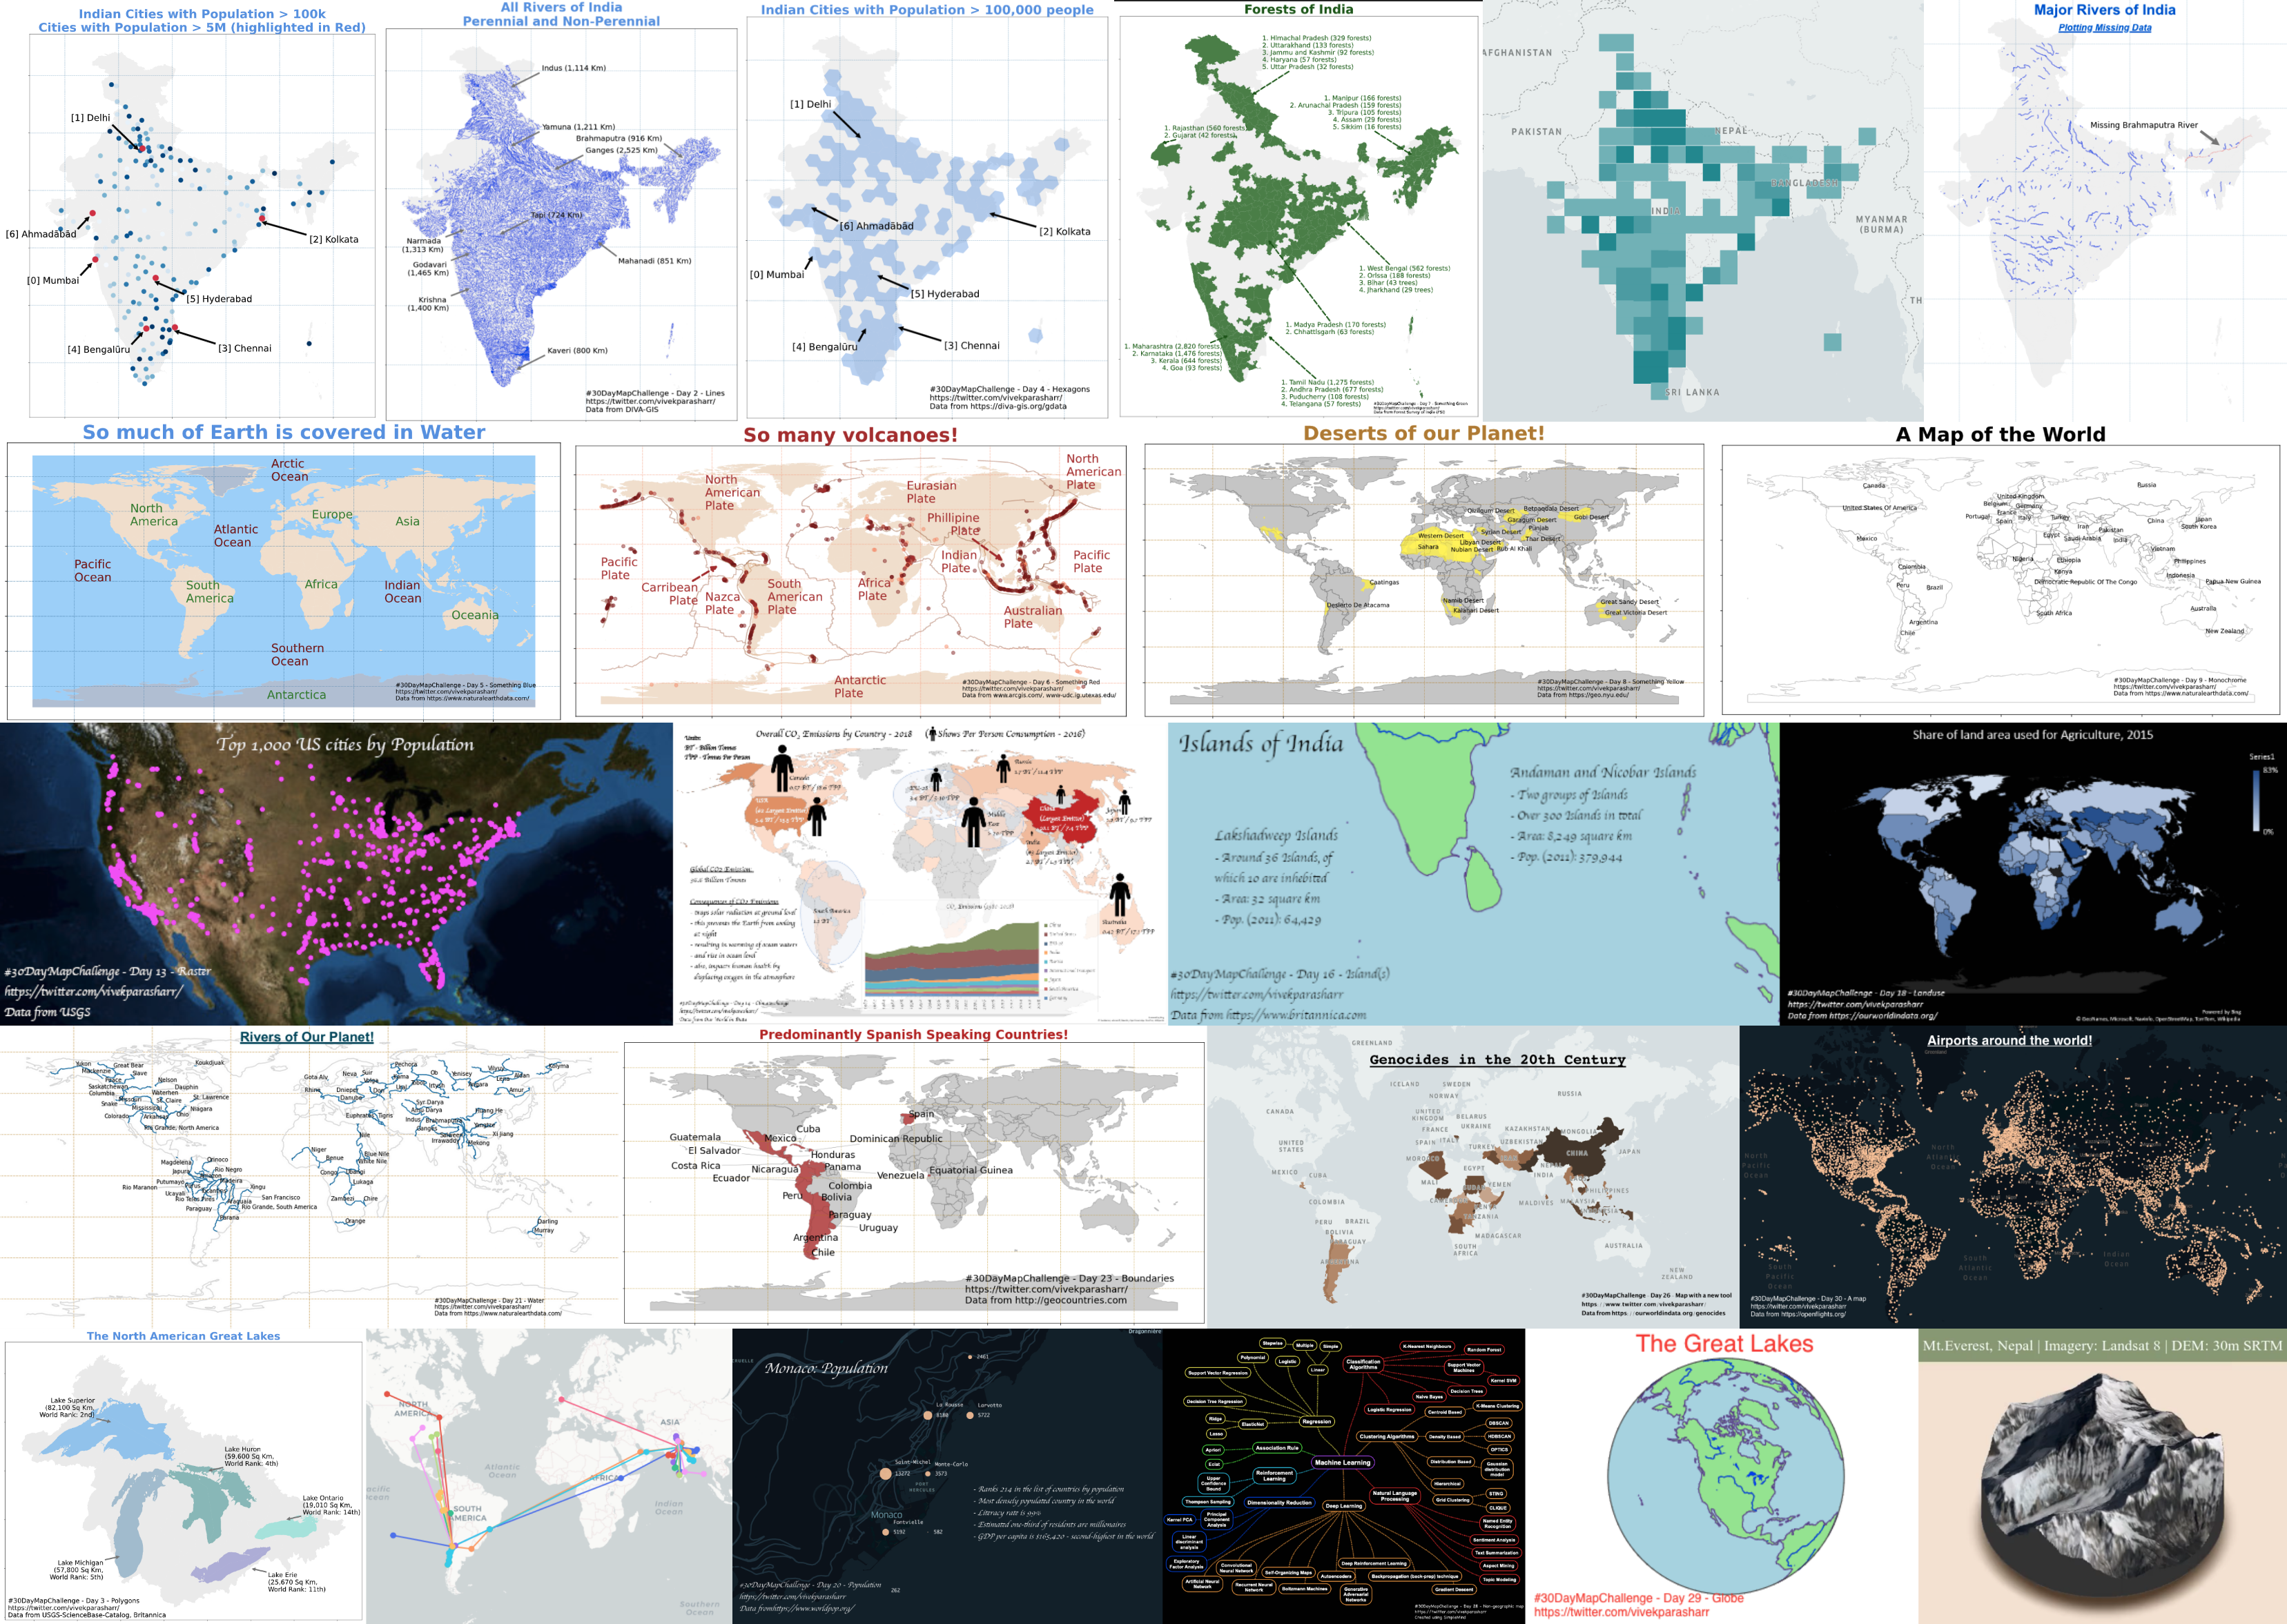
30 Day Daily Map Challenge
The #30DayMapChallenge was a daily social mapping project held in November 2020 that I participated in. I had a good understanding of Python before participating but very less knowledge of working with GIS data. So I had plotted some data on maps using Microsoft Excel, the data for which was usually in tabular format in an Excel or CSV. However, I had never heard of Shape files, DEM – Digital Elevation Models, DSM – Digital Surface Models, or DTM – Digital Terrain Models, etc. Understanding these formats, what they contain and how they can be processed was the biggest challenge I encountered.
GeoPandas is a Python library for working with geospatial data, built on top of the Pandas library. It extends the Pandas data analysis library to enable spatial operations on geometric types. GeoPandas provides data structures to represent geometric objects (points, lines, polygons) and allows for spatial operations on them, such as intersection and distance. GeoPandas also provides tools for reading and writing geospatial data in various formats and for visualizing geospatial data.
How to install GeoPandas?
GeoPandas makes it a breeze to deal with these file formats, however the challenge is to install it. GeoPandas usually has conflicts while installing and the best way that I found to install it was to first install Anaconda Python. Post that we create a new environment and install GeoPandas in that.
conda create –n geopandas_env   #create a new environment
conda activate geopandas_env   #activate this environment
conda config — env — add channels conda-forge  #add conda-forge channel to your environment
conda config — env — set channel_priority strict  #make conda-forge your first priority to install any package so that dependent package won’t conflict
conda install python=3 geopandas  #install GeoPandas using conda
Basic steps to use Geopandas
Now we have GeoPandas installed, lets move on to the interesting part. Here are some basic steps to use Geopandas:
# importing the Geopandas library
import geopandas as gpd

# Read data: Load the data from the shapefile or other geospatial data sources. You can use the following command to read shapefiles:
data = gpd.read_file('/path/to/shapefile.shp')

# Explore the data: Geopandas data is stored in a pandas dataframe. You can explore the data using the same commands you would use for any pandas dataframe, for example:
data.head()
data.info()
data.describe()

# Plotting: Geopandas provides some basic plotting functionality. You can plot the data using the following command:
data.plot()

# Geospatial operations: You can perform a wide variety of geospatial operations on the data using Geopandas. Here are some examples:

# Subset data based on spatial location:
bbox = (xmin, ymin, xmax, ymax)
subset_data = data.cx[bbox[0]:bbox[2], bbox[1]:bbox[3]]

# Buffering points:
data['buffered'] = data.buffer(distance)

# Overlaying data:
overlay_data = gpd.overlay(data1, data2, how='intersection')

# Spatial joins:
join_data = gpd.sjoin(data1, data2, how='inner', op='intersects')
How to create a map in GeoPandas
Here’s an example code to create a map of India and plot its states on it using GeoPandas. In this example, we first load the shapefiles for India and the state boundaries using GeoPandas’ read_file function. We then create a figure and axis object using Matplotlib’s subplots function and plot the India map on the axis object. Finally, we plot the state boundaries on top of the map and add a title to the plot using Matplotlib’s set_title function. The resulting plot will show the map of India with the state boundaries plotted on top of it.
import geopandas as gpd
import matplotlib.pyplot as plt

# Load the shapefile for India and the state boundaries
india = gpd.read_file('path/to/India.shp')
states = gpd.read_file('path/to/India_States.shp')

# Create a figure and axis object
fig, ax = plt.subplots(figsize=(10, 10))

# Plot the India map
india.plot(ax=ax, color='lightgrey', edgecolor='white')

# Plot the state boundaries on top of the map
states.plot(ax=ax, color='none', edgecolor='black', linewidth=0.5)

# Add a title to the plot
ax.set_title('Map of Indian States')

# Show the plot
plt.show()
Where can you download geospatial data from?
There are many places where you can download geospatial data from, depending on your needs. Some common sources of geospatial data include:
- USGS EarthExplorer: The USGS EarthExplorer is a great source for downloading aerial and satellite imagery, as well as elevation data.
- Natural Earth: Natural Earth is a public domain map dataset available at a variety of scales, from 1:10m to 1:250m, which can be used for web mapping and GIS projects.
- OpenStreetMap: OpenStreetMap is a community-driven map dataset that can be used to create custom maps and for geocoding applications.
- NASA Earthdata: NASA Earthdata provides access to a wide range of earth science data, including satellite imagery and climate data.
- Global Administrative Areas (GADM): GADM provides administrative boundaries for countries, including states and counties.
- WorldClim: WorldClim provides global climate data at a range of spatial resolutions.
- National Oceanic and Atmospheric Administration (NOAA): NOAA provides a range of geospatial data, including marine and coastal data, as well as weather and climate data.
Best practices for working with geospatial data
Working with geospatial data can be challenging and requires some best practices to ensure the accuracy and reliability of your results. Here are some best practices for working with geospatial data:
- Use projections: A projection is a mathematical method for representing the curved surface of the Earth on a flat map. Different projections are suitable for different regions and uses. Be sure to use an appropriate projection for your data.
- Check data quality: Before using any geospatial data, it’s important to check for completeness, consistency, and accuracy. You can do this by examining the metadata, visualizing the data, and performing data validation.
- Manage data volumes: Geospatial data can be extremely large, especially if you are working with high-resolution imagery or vector data. Be sure to manage your data volumes carefully, using techniques such as data compression, subsampling, and tiling.
- Choose the right software: There are many software options available for working with geospatial data, including open source tools like QGIS and proprietary tools like ArcGIS. Choose a tool that is suitable for your data and your workflow.
- Document your workflow: Document your workflow and the decisions you make as you work with your geospatial data. This can help you reproduce your results and share your findings with others.
- Use cloud-based services: Cloud-based services can provide easy access to geospatial data and processing power, especially for large data volumes or complex analysis workflows.
- Be mindful of licensing: Many geospatial datasets have specific licensing requirements, and it’s important to be aware of these before using the data. Be sure to read and follow the license terms carefully.
- Seek out community resources: The geospatial community is large and active, with many resources available online. These can include tutorials, forums, and code repositories. Seek out these resources to learn from others and to share your own experiences.
On a closing note, Geospatial data is an exciting and rapidly evolving field, and working with it can be a lot of fun. Participating in challenges like the 30-day map making challenge can be a great way to improve your skills and learn new things.
Comments welcome!